Science of CHEOPS
Due to the small sample and the large error bars, the mass-radius relation for planets ranging from 20 MEarth down to 1 MEarth is essentially unknown. CHEOPS will provide a fundamental break-through by significantly improving both the sample size as well as the precision of the measurements. We anticipate these new data will reveal significant intrinsic scatter rather than a simple relationship. This spread will reflect the rich diversity of conditions realized in the formation and evolution of planetary systems, and thus can be used to constrain models of these processes.
In the core accretion scenario, the core of a planet must reach a critical mass before it is able to accrete gas in a runaway fashion. This critical mass depends upon many physical variables, among the most important of which is the rate of planetesimals accretion.
The determination of the mean planetary density can provide a lower limit for the mass of the gaseous envelope. For example, as can be seen from Fig. 2, a 5 MEarth Earth-like planet composed of 50 % solid terrestrial composition and 50% water vapour has a radius roughly twice as large as the same mass planet of purely terrestrial composition. In light of recent studies indicating that low density super-Earths with large rocky cores and hydrogen envelopes may survive outgassing, it seems the presence of a significant H/He envelope would have an even more dramatic effect on the radius due to the reduced molecular weight compared to water. Similar conclusions can be reached assuming that the planetary core is composed of pure water ice. Indeed, for a given mass, the radius of a pure water planet (see Fig. 2) represents an upper limit for the radius of a planet without an envelope. Therefore, a lower limit to the envelope mass can be derived (as a function of assumed envelope composition) by matching the observed radius and mass, assuming a pure water ice core, a composition of the envelope, and a temperature (corresponding to the equilibrium temperature with the stellar flux, an adequate assumption if the planet is not located too close to its star).
Using observations of a sample of planets with and without significant gaseous envelopes we will be able to infer the critical mass as a function of the distance to the star and possibly stellar parameters (mass, metallicity). This will be especially true for planets located not too close to their stars for which evaporation is not an issue. Interestingly enough, the determination of the mass of the gaseous envelope of planets in the Uranus-Neptune mass range is also related to the formation and composition of these two planets in our own solar system. While at present it is not clear why these two planets did not succeed in accreting a large amount of gas, measuring the composition (in term of gas content) of planets of similar mass, but at various distances to the central star, will shed light on the processes at work during the formation of Uranus and Neptune.
Yet even observations of planets for which it will be impossible to infer unambiguously the presence of a thick atmosphere (those located below the blue line in Fig. 2) provide strong constraints on formation models in a statistical sense. There is ample evidence that planets are not born where they are observed today but that they have migrated during their formation possibly over large orbital distances. The present day observed location could therefore have been reached following different paths depending upon the growth history of the planet, as well as interactions with the gaseous disc or with other planets. Each of these paths samples different regions of the proto-nebula in varying proportions leading to unique combinations corresponding to the growth history and chemistry appropriate for the amount of time spent at a given orbital radius. As a result, the bulk composition, and hence the mean density, will depend upon which track was followed (see Fig. 3). CHEOPS will be unique in providing a sufficiently large sample of planets with accurate densities to allow discriminating between common groups of migration paths. The vast majority of Kepler targets are too faint to enable precise mass determination (and hence density) and thus the available sample is not adequate.
Our lack of understanding concerning the structure of small planets is currently a serious limitation to realizing our dream of eventually detecting life through remote sensing. A super-Earth planet outgassing 10 000 bar of H2O steam during magma ocean solidification may accumulate huge amounts of oxygen and hydrogen (Lammer et al. 2012). These conditions may lead one to question the robustness of some proposed biomarkers (e.g. O3). Only planets without sizeable atmospheres represent interesting targets for future habitability studies. The presence of a gaseous envelope, even only a few percent by mass, implies such high densities and pressures at the surface of the planet, that life would be unlikely2 under such conditions. CHEOPS, by identifying planets that are more likely to have a thin envelope, will provide prime targets for future facilities. The capability of CHEOPS to detect the phase curve of Hot Jupiters in the optical regime will provide information on planet albedos. This has been well measured for CoRoT-1b (Snellen et al. 2009) and HAT-P-7b (Borucki et al. 2010, Fig. 1) with the CoRoT and Kepler missions, respectively. The detailed shape and amplitude of the phase curves represent a powerful tool to study the thermal distribution in the atmosphere (e.g. HD189733b, Knutson at al. 2007) and therefore the physical mechanisms and efficiencies of the energy transport from the dayside to the night side of the planet. Since this effect can be seen on any hot Jupiter planet, including non-transiting geometrical configurations, the number of potential targets amongst hot Jupiters detected orbiting bright stars is significant. Extending CHEOPS to the near IR (from 1.1 to 1.7 micron) microns would be very powerful as a tool to directly detect thermal emission, better constraining the planetary energy budget.
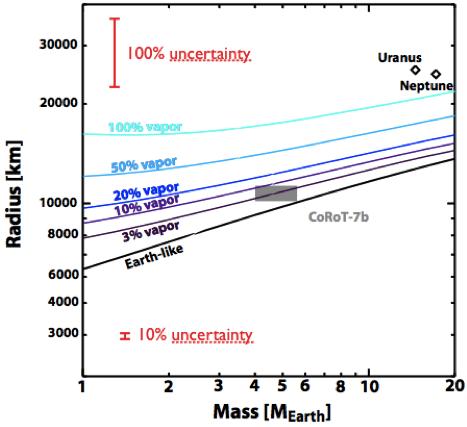
Fig. 2: Radius of a hot rocky planet surrounded by a water atmosphere. The composition of the planetary core is similar to the one of the Earth, and the mass of the water envelope is indicated on the figure (in percentage of the total planetary mass). Adapted from Valencia et al. (2010).
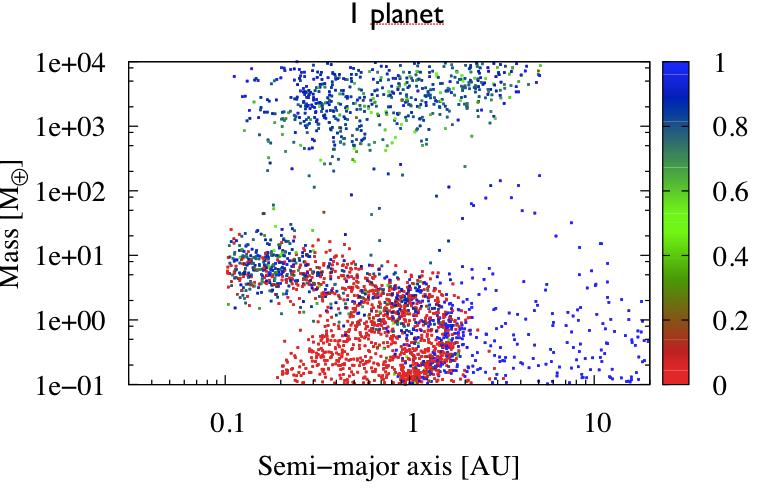
Fig. 3a: Mass versus semi-major axis diagrams for two sets of planet population synthesis. The colour code indicates the fraction of icy planetesimals in the planetary cores. In this figure, a single planet is allowed to grow in a disc.
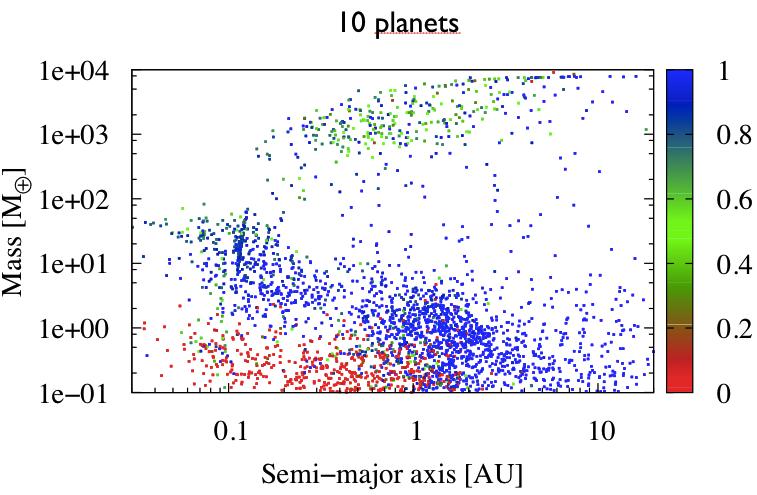
Fig 3b: 10 planets are allowed to grow simultaneously. The difference in ice content between the two models translates into a difference of ~30% in mean radius, for planets in the super-Earth to Neptune mass range. The measurement of planetary mean density in this mass range can therefore help to disentangle between the two models.
2As a comparison, the mass of the Earth’s atmosphere is less than 10-6 Earth masses.