Science Measurements in Detail
The contrast, the timing sequence of the event, and the detailed shape of the transit light curve provide: (1) the geometry of the eclipse and the ratio of the planetary radius to that of the star, (2) the period of the orbit and (3) the density of the star (direct outcome of Kepler’s law from the ingress/egress timing of the transit). These parameters together with the effective temperature of the stellar atmosphere and an evolutionary model allow retrieving the mass and the radius of the star and finally the determination of the radius of the planet. (Mazeh et al. 2000; Hebb et al. 2009). The precision of this determination is therefore directly affected by the precision to which the stellar parameters are known.
The ratio of the depth of the light curve during a transit to the noise (rms) averaged over the duration of the transit defines the transit signal-to-noise (S/Ntransit). In the case of a hot Neptune, the transit duration is typically 3 hours, for a “warm” Earth it is about 6 hours. In both cases one considers that S/Ntransit = 5 is required to obtain a clear detection (see Fig. 5) and S/Ntransit=30 to obtain the radius of the planet with good precision. Measurements of planetary radii to 10% accuracy may be achieved on giant planets provided an accurate stellar density and spectroscopic measurement of the effective temperature and metal content of stellar atmosphere are available.
A precise stellar density can be measured by asteroseismology at a cost of an intensive and long observation campaign or by using an IR flux approach combined with precise parallaxes (Bakos 2010). Alternatively, for high signal-to-noise transit light curves (typically for giant or Neptune-sized planets) the stellar density can directly be computed from the shape of the transit light curve. In this case, the precision on the stellar density can reach a few percent for high signal-to-noise light curves.
Regardless of the approach used, the final accuracy on the stellar parameters (mass and radius) depends upon the precision of stellar models and systematics in effective temperature estimates. For bright stars a combination of different technics has proven to be adequate to reach the required accuracy even using ground-based light curves (e.g. recent work on GJ1214, by Kundurthy et al. 2011). For some of the brightest stars, a direct interferometric measurement may even be possible.
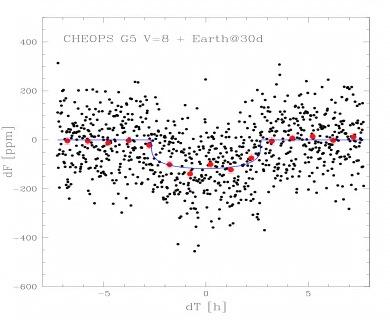
Fig 5: Simulation of a transiting Earth size-sized planet of 60 day period orbiting a G5 star of 8th V-magnitude as observed by CHEOPS. Sampling time is 1 minute and photon noise 100 ppm/minute. The red dots indicate 1h-averaged photometry. This light curve illustrates a transit detection with a S/Ntransit=10.